- The Noiseless Trader's Newsletter
- Posts
- Your guide to intraday levels? 🤫🤫
Your guide to intraday levels? 🤫🤫
A Deep-dive into Pivot Levels and how you can use it
Kaushik Akiwatkar
August 23, 2025


If someone forwarded this, join 1000+ others to get actionable trading & investing strategies in your mailbox every other weekday.
In intraday trading, trades are initiated and squared off on the same day. Because the time frame is limited, precision in predicting price movement is essential. This makes it important to identify probable support and resistance levels that can influence price action. One of the tools that guides a trader in identifying these levels is Pivot Support and Resistance levels, or simply known as Pivot Levels. This tool identifies probable support and resistance zones and act as a guide for intraday traders.
In today’s newsletter, let us understand how this tool is calculated and learn how to use it for intraday trading.
Pivot and its levels
Pivot Support and Resistance Levels
There are seven key pivot levels:
1 Pivot Point (P)
3 Support Levels (S1, S2, S3)
3 Resistance Levels (R1, R2, R3)
These levels are derived from the previous day’s High, Low, and Close prices and are plotted on intraday timeframes (any chart period shorter than the Daily timeframe).
Formulas for these levels are as follows:
Pivot Point (P): (Previous Day High + Previous Day Low + Previous Day Close) ÷ 3
Support Levels:
• S1 = (P × 2) – Previous Day High
• S2 = P – (Previous Day High – Previous Day Low)
• S3 = S1 – (Previous Day High – Previous Day Low)Resistance Levels:
• R1 = (P × 2) – Previous Day Low
• R2 = P + (Previous Day High – Previous Day Low)
• R3 = R1 + (Previous Day High – Previous Day Low)
These levels are considered objective because they are derived from the previous day’s data and remain identical for all traders, regardless of who is trading. In contrast, subjective levels vary from one trader to another based on individual interpretation.
Using Pivot Support and Resistance
Among the seven levels, the Pivot Point or Pivot Level is the most significant. It is calculated as the average of the previous day’s high, low, and close prices. This level is referred to as the “Pivot” because it often serves as a key point where price action may either find strong support or encounter strong resistance during the day depending on where the price is trading.
Pivot support and resistance levels work both ways, regardless of their labels. A level acts as support when the price is above it and becomes resistance when the price is below it. These levels divide the chart into clear zones, helping traders identify potential support and resistance areas for better trade planning. For example, if the price is trading between the Pivot and R1, and it breaks above R1 to move between R1 and R2, R1 will then act as support while R2 will act as resistance.
Examples
Observe the chart below of Nifty 50 on 15-min TF on 13th Aug 2025. The price was initially trading between Pivot and R1 level. This mean the Pivot would act as support and R1 would act as resistance. The index took support from the Pivot point twice and then faced resistance at R1. Even though the price breached R1, it formed a Market Structure High pattern (marked in black box), which confirmed R1 was acting as resistance.
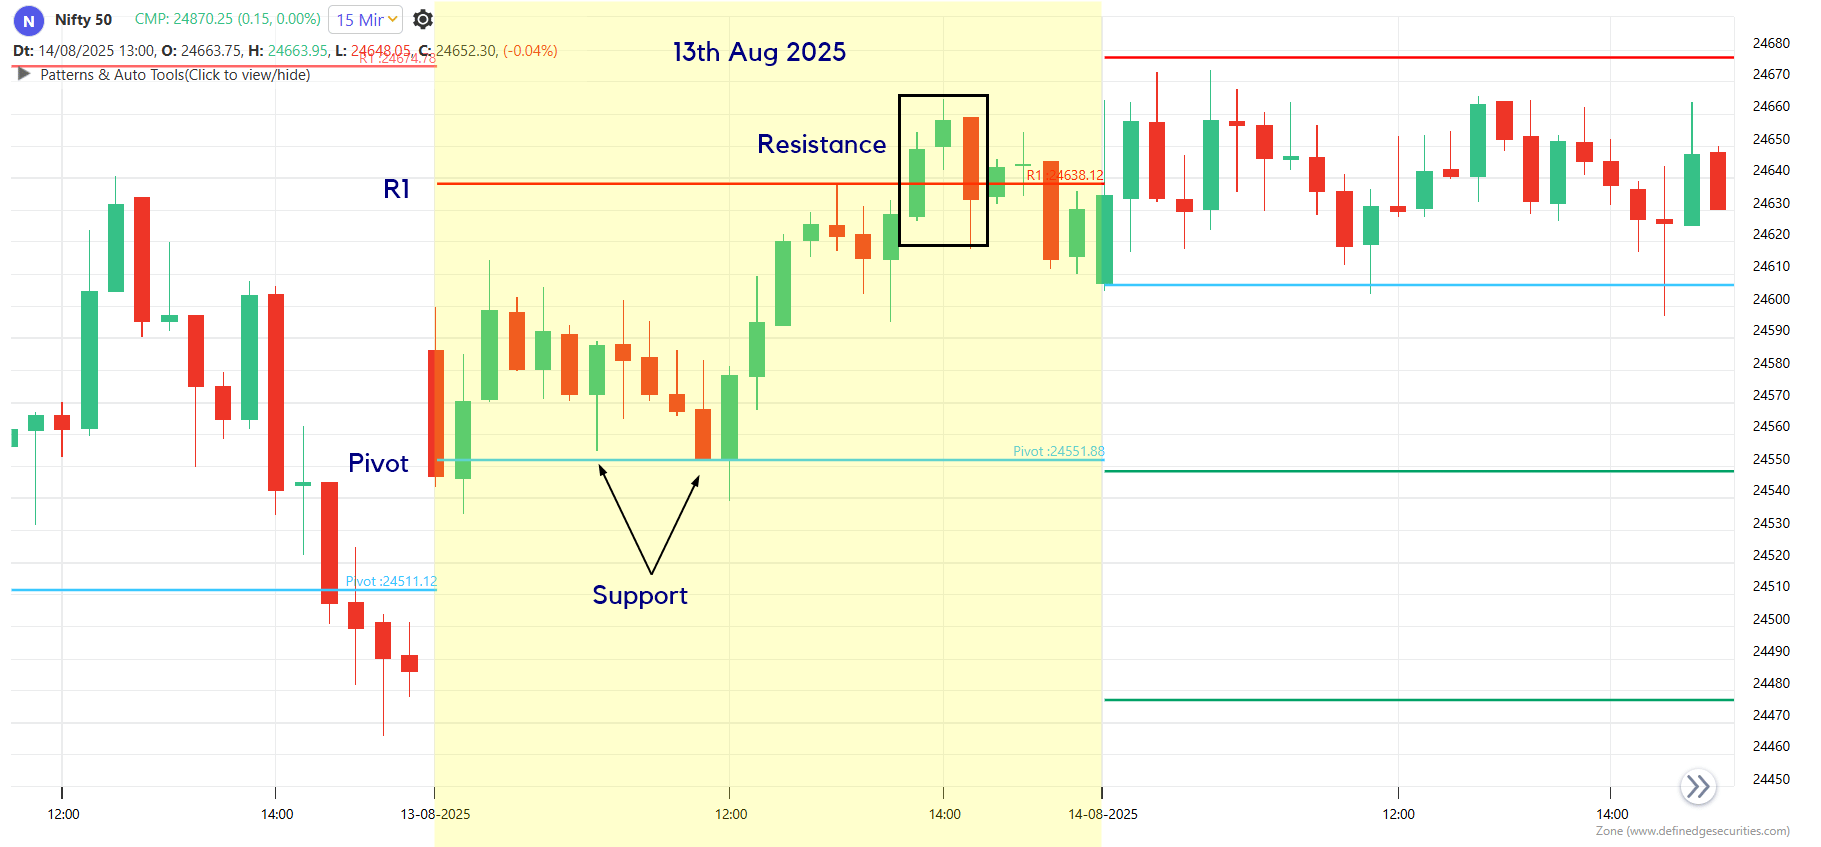
Nifty 50 (15-min) TF
Observe the chart below of 360ONE on 15-min TF on 19th Aug 2025. The price was trading between Pivot and R1. The price initially took support from Pivot. Subsequently, when the price was near R1, the price took resistance, as indicated by the wicks near the R1 level.
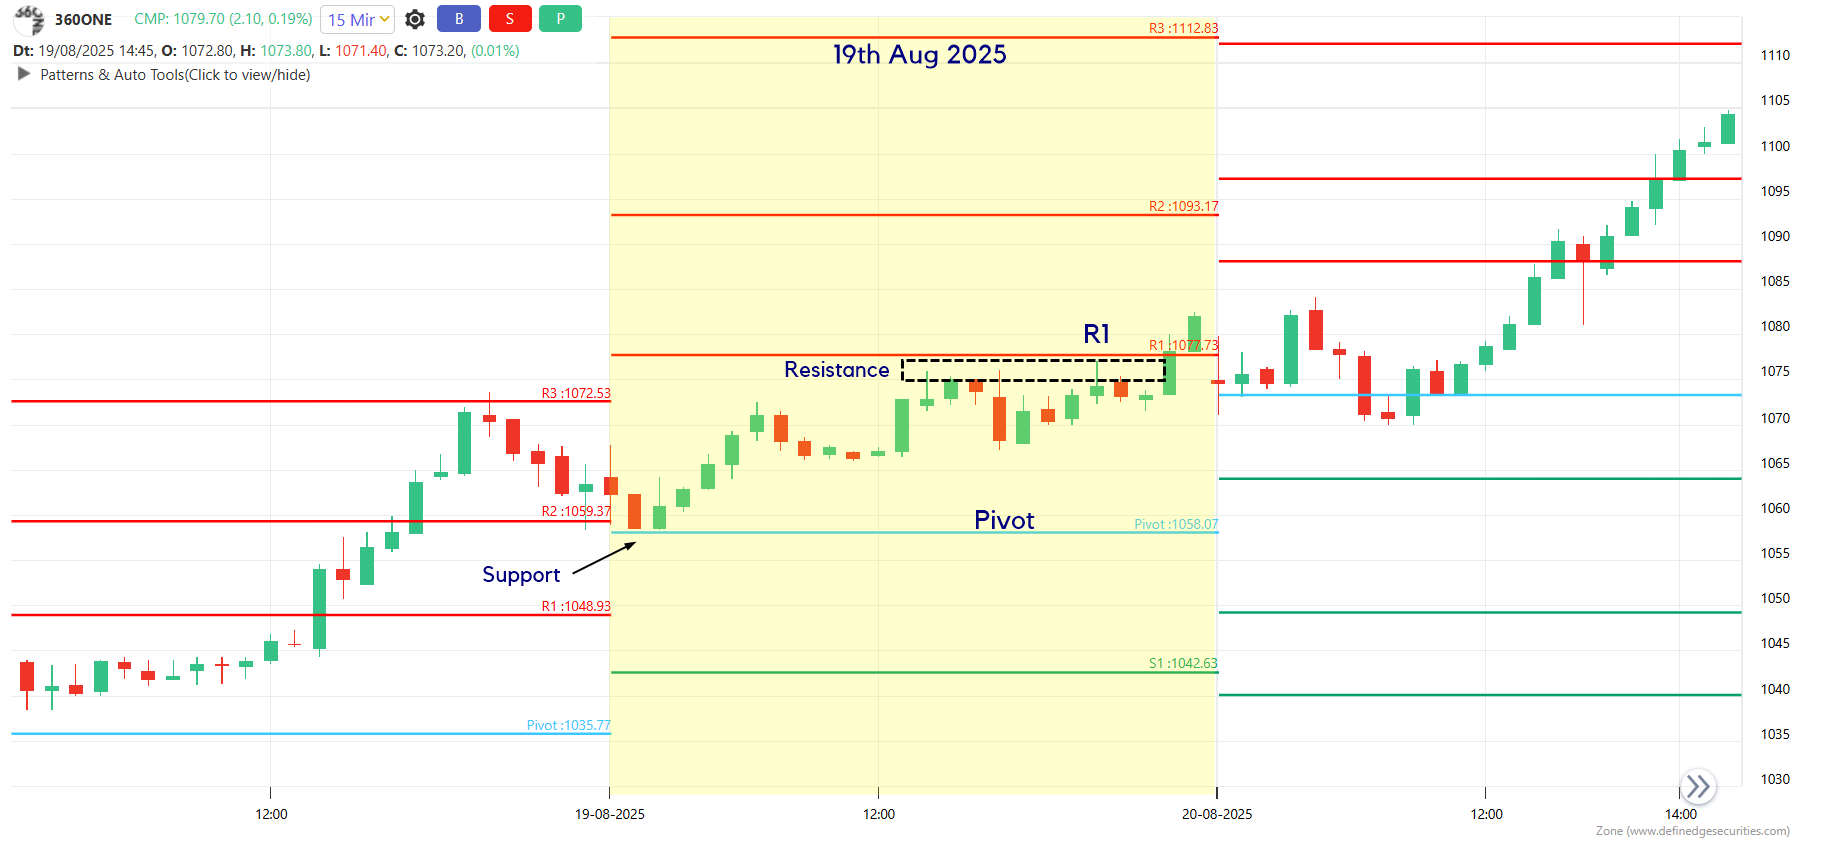
360ONE (15-min) TF
The chart below is of CIPLA on 15-min TF on 6th Aug 2025. The price was trading between S1 and S2 levels initially. The price took support from S2 level. When the price was near S1 level, the price formed an MSH and confirmed resistance at S1.
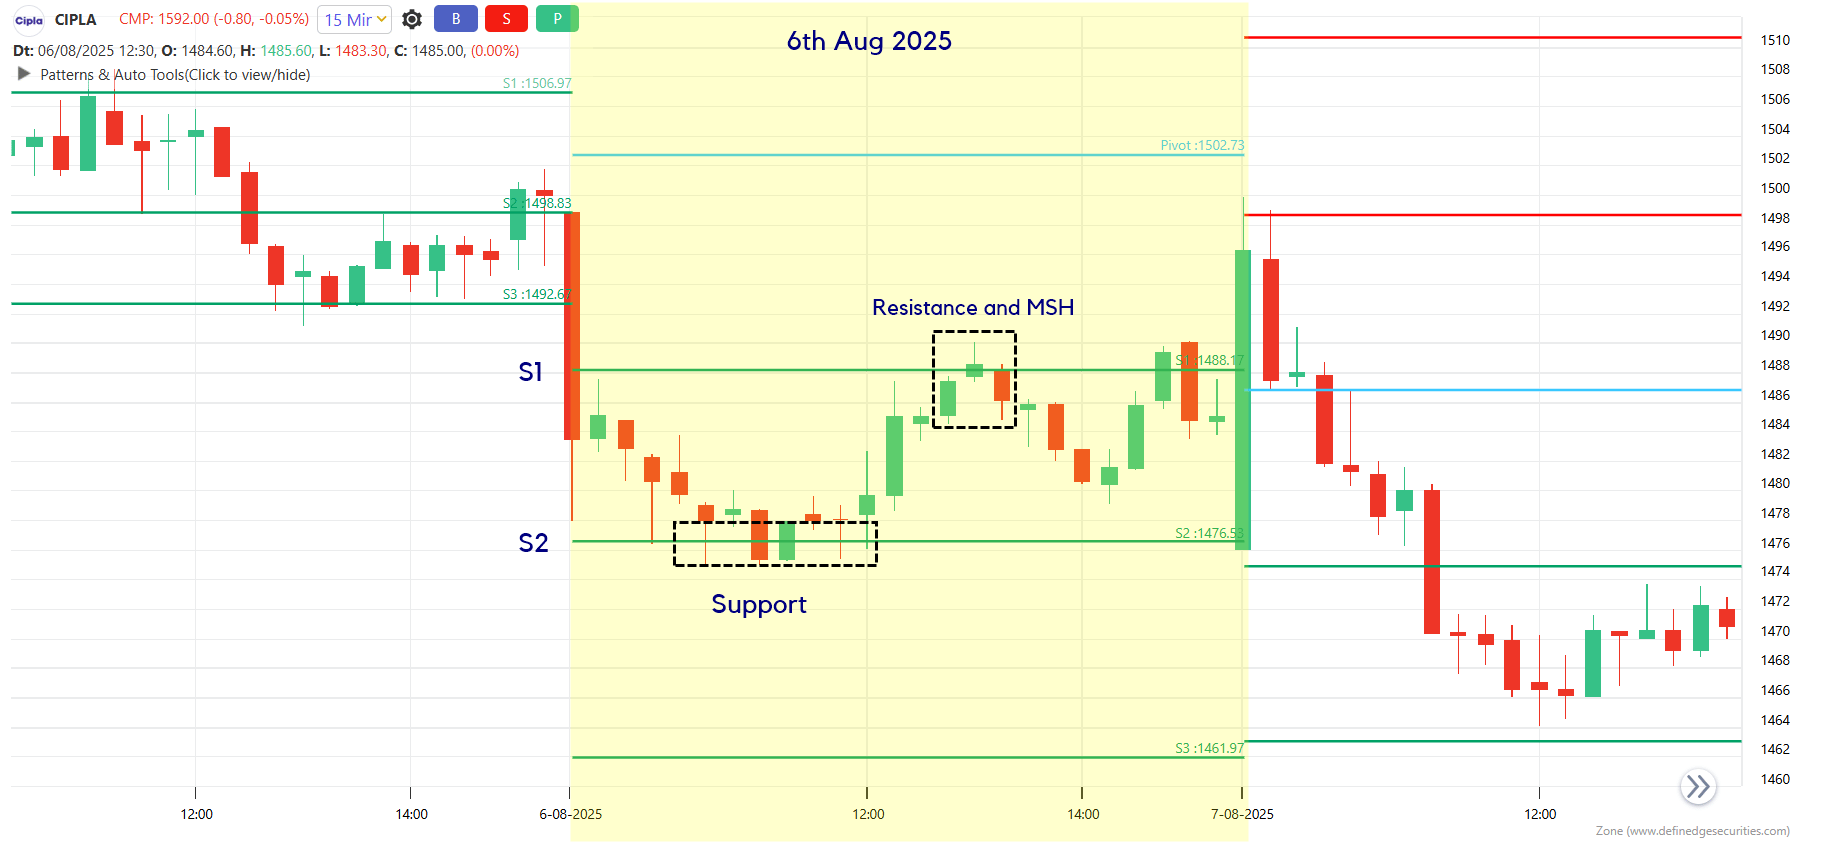
CIPLA (15-min) TF
Pivot Support and Resistance is a great tool for intraday traders because the levels are clear and the trades are short-lived. Adding pattern analysis with this tool brings an edge to the system. A further layer of analysis can be added by incorporating higher timeframe analysis. Because this tool is objective, it can also be plotted on other charting methods such as Point and Figure and Renko.
Pivot Support and Resistance is just one of the many powerful tools you can use for intraday trading. But trading successfully goes far beyond a single tool or indicator. If this newsletter has sparked your curiosity and you truly want to understand trading at a deeper level, the upcoming TNT Bootcamp 2.0 is your chance to transform your approach to the markets.
The TNT Bootcamp 2.0 is not just another course; it is an intensive, hands-on program designed to help you understand trading from the ground up. We go beyond memorizing setups and explore price action, multiple charting methods, patterns, and indicators, breaking down the real logic behind each. You will learn risk management, position sizing, trading psychology, and how to build your own trading system from scratch, while also gaining insights into the exact setups and frameworks I personally use. Whether you are a beginner or looking to sharpen your edge, this annual program is your chance to gain practical, actionable knowledge that can transform the way you trade.
If you have been wondering how to take your first real step into your trading journey, there is no better time than now. Do not miss this opportunity to learn trading the right way. Enroll today and start building the foundation for your journey in the markets. Admissions closing soon 👇👇👇
