- The Noiseless Trader's Newsletter
- Posts
- Similar zone. Similar pattern. But most miss it 🤯
Similar zone. Similar pattern. But most miss it 🤯
Confirm continuations with clarity using Pattern Retest
Kaushik Akiwatkar
July 21, 2025

If someone forwarded this, join 1000+ others to get actionable trading & investing strategies in your mailbox every other weekday.
In traditional technical analysis, trend reversals are often identified through “M” or “W” shaped formations, known as Double Top and Double Bottom patterns. These patterns are usually observed on Candlestick charts, but such charts can kick-in subjectivity and noise when analysing using Candlestik charts. In Point and Figure charts, the same concept is captured more objectively through Pattern Retest. In today’s newsletter, let us understand Pattern Retest to identify reversals.
What is Pattern Retest?
As the name suggests, a Pattern Retest occurs when the price revisits a particular level and forms a pattern of similar nature to the one that had previously appeared at a similar level. For instance, if a Bullish Trap pattern had formed earlier, the price must form a bullish pattern again when it revisits similar levels. This revisit may not occur at the exact same price point but often happens in the similar price zone. Patterns that may appear during such retests include Trap patterns and its variations, Poles and their variations, and Anchor patterns.
Therefore, when the price forms a Double Top pattern (a “M” pattern), which signifies a probable bearish reversal, it must display bearish patterns at both peaks. This is a Bearish Pattern Retest. Similarly, when forming a Double Bottom pattern (a “W” pattern), which indicates a probable bullish reversal, the price must form bullish patterns at both lows.
How to trade Pattern Retest?
Although a Pattern Retest can serve as a sign of caution during a major trend reversal, it can also be used to trade in the direction of the ongoing trend. For example, we can use Bullish Pattern Retest to participate in an ongoing bullish trend.
Observe the chart below of FSL and BHEL on 0.5% (Daily) box size. The EMA lines are hidden to view the pattern clearly. On the FSL chart, the price formed a Bear Trap variation and Bear Trap at similar levels in an uptrend. On BHEL chart, the price formed a Bear Trap and 100% pole pattern. The Bullish Pattern Retest would have acted as a confirmation of continuation and we could have participated in the ongoing trend subsequently.
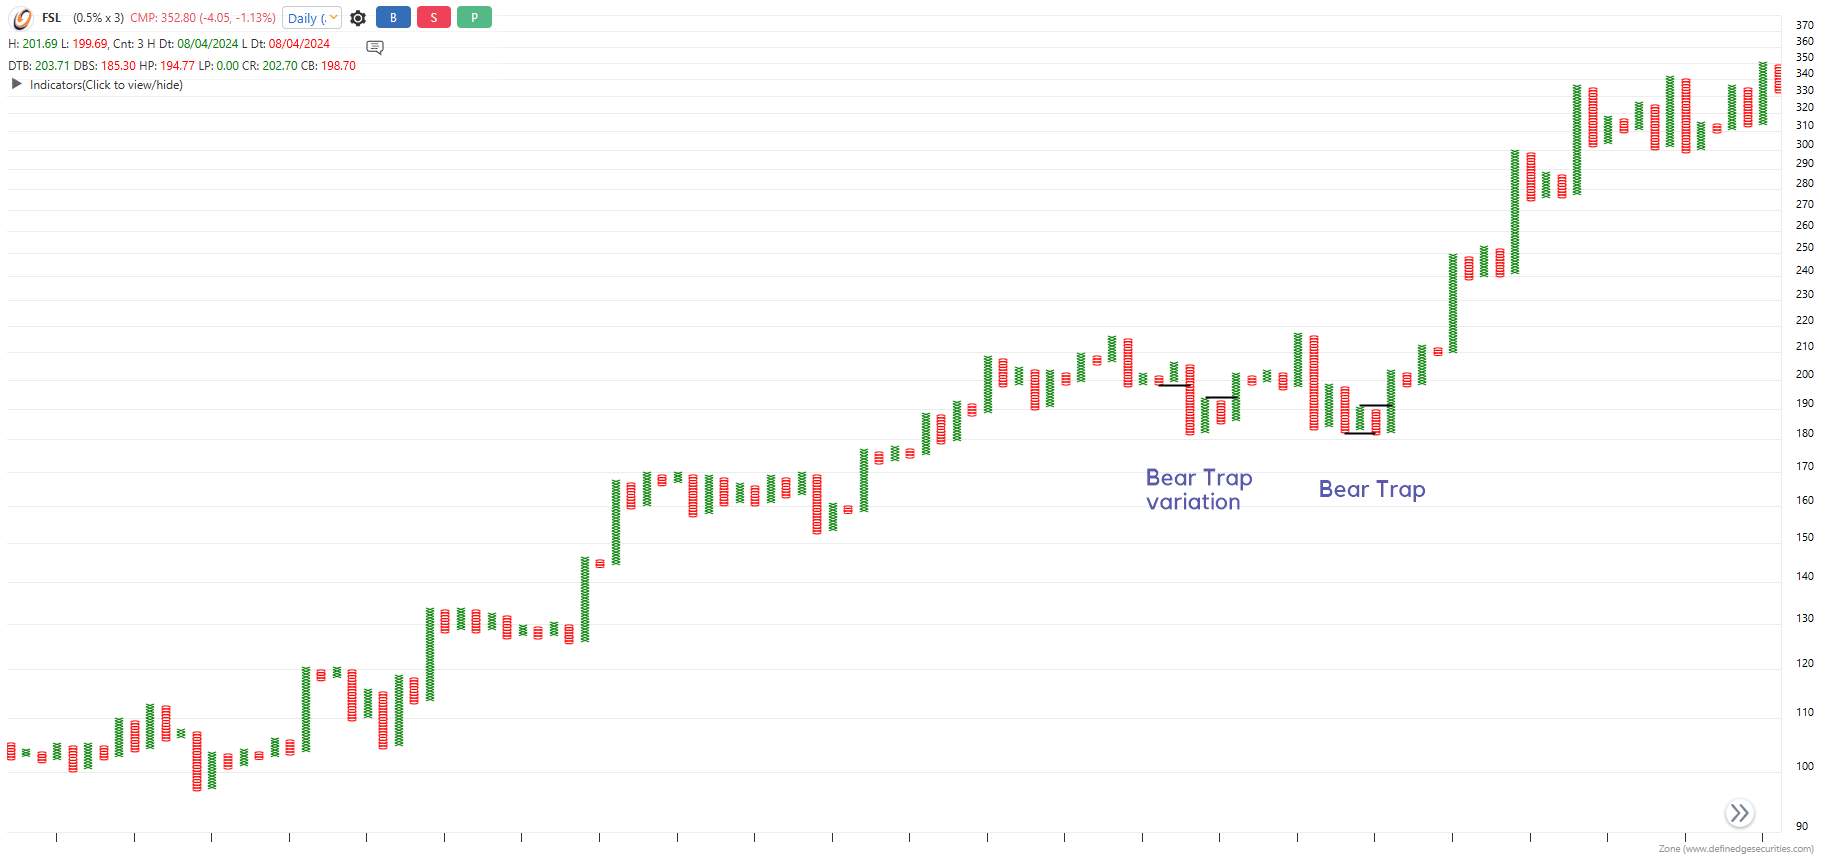
FSL 0.5% (Daily TF)
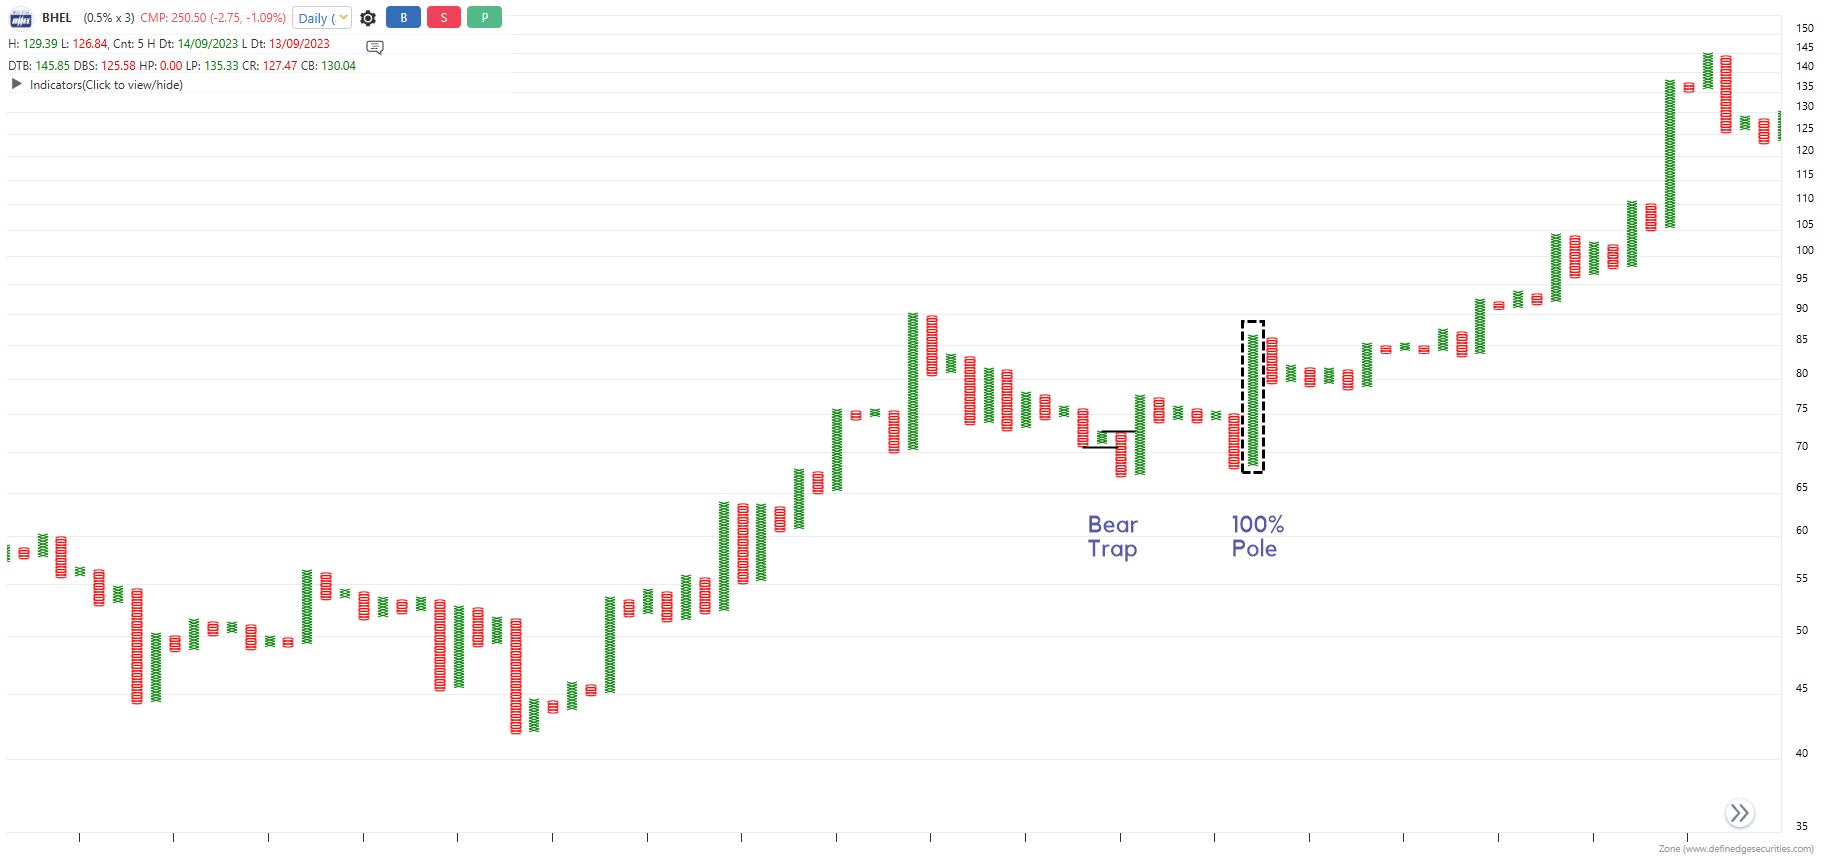
BHEL 0.5% (Daily TF)

A similar structure can be observed on the chart below of M&M but on 1% (Daily) box size. The price formed a Bear Trap variation and a Low Pole. Both the patterns indicated demand at similar levels.
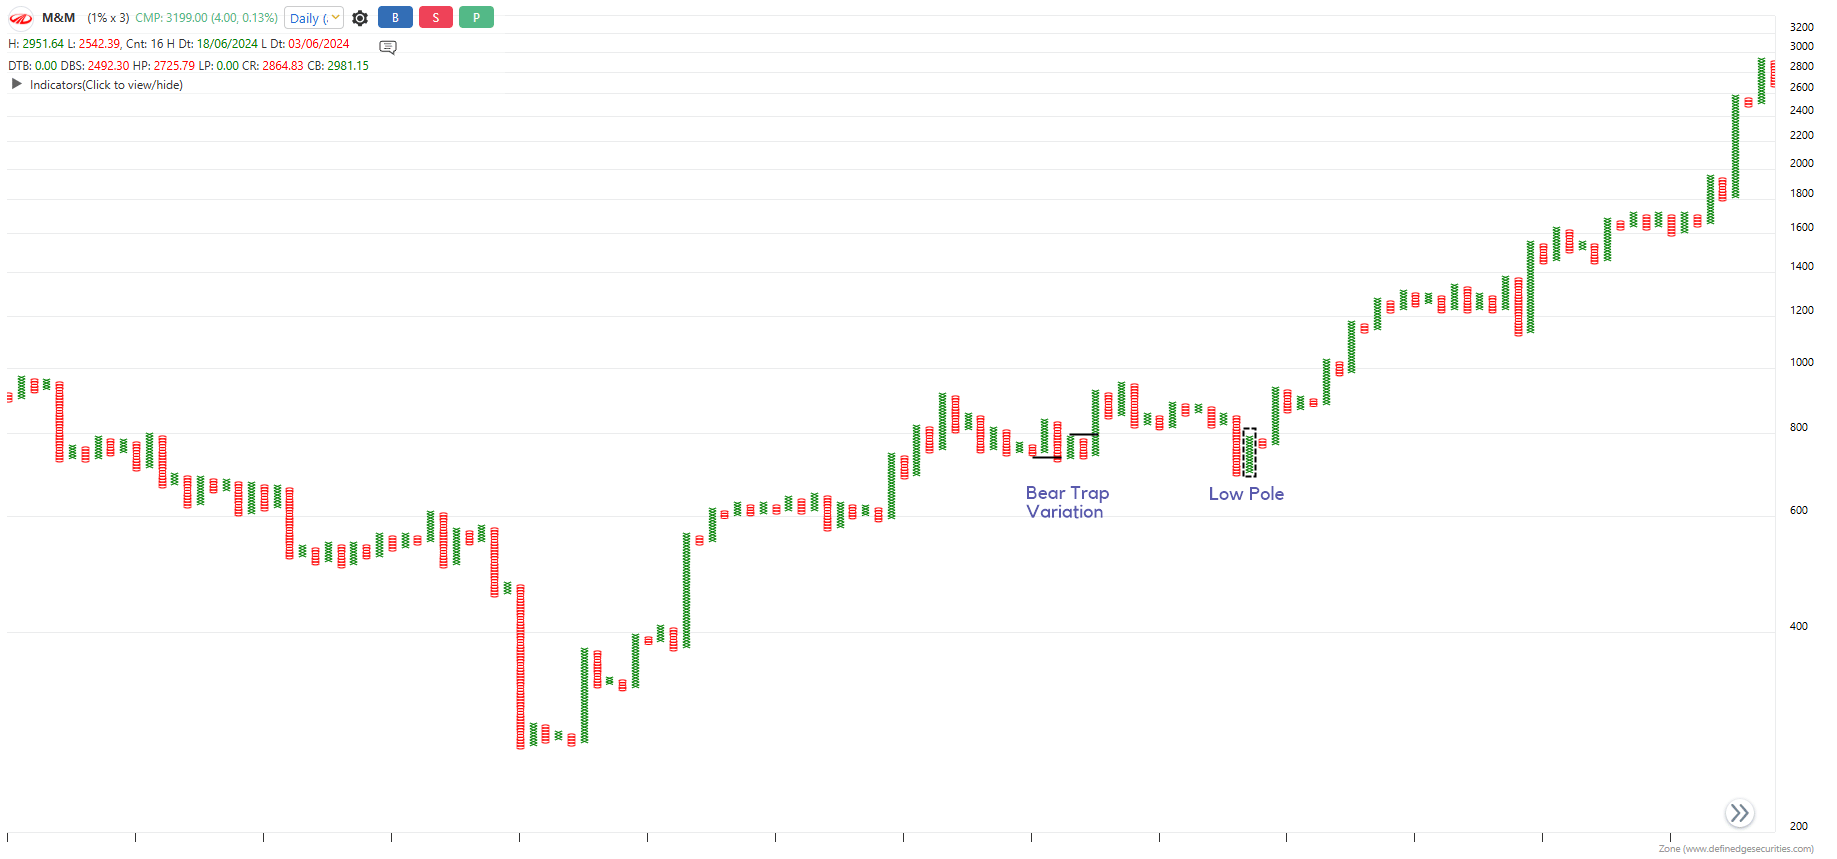
M&M 1% (Daily TF)
While traditional technical concept dictate to use Double Top and Double Bottom patterns as reversal patterns, they can also be used as continuation patterns.
If this newsletter sparked your interest in market analysis and trading, TNT One could be your next step forward. With access to all current and upcoming courses, weekly live sessions that connect theory with real-time market analysis, and exclusive members-only webinars, it is designed to support consistent, structured, and in-depth learning.
Start your journey with TNT One and elevate the way you learn, analyse, and trade.
